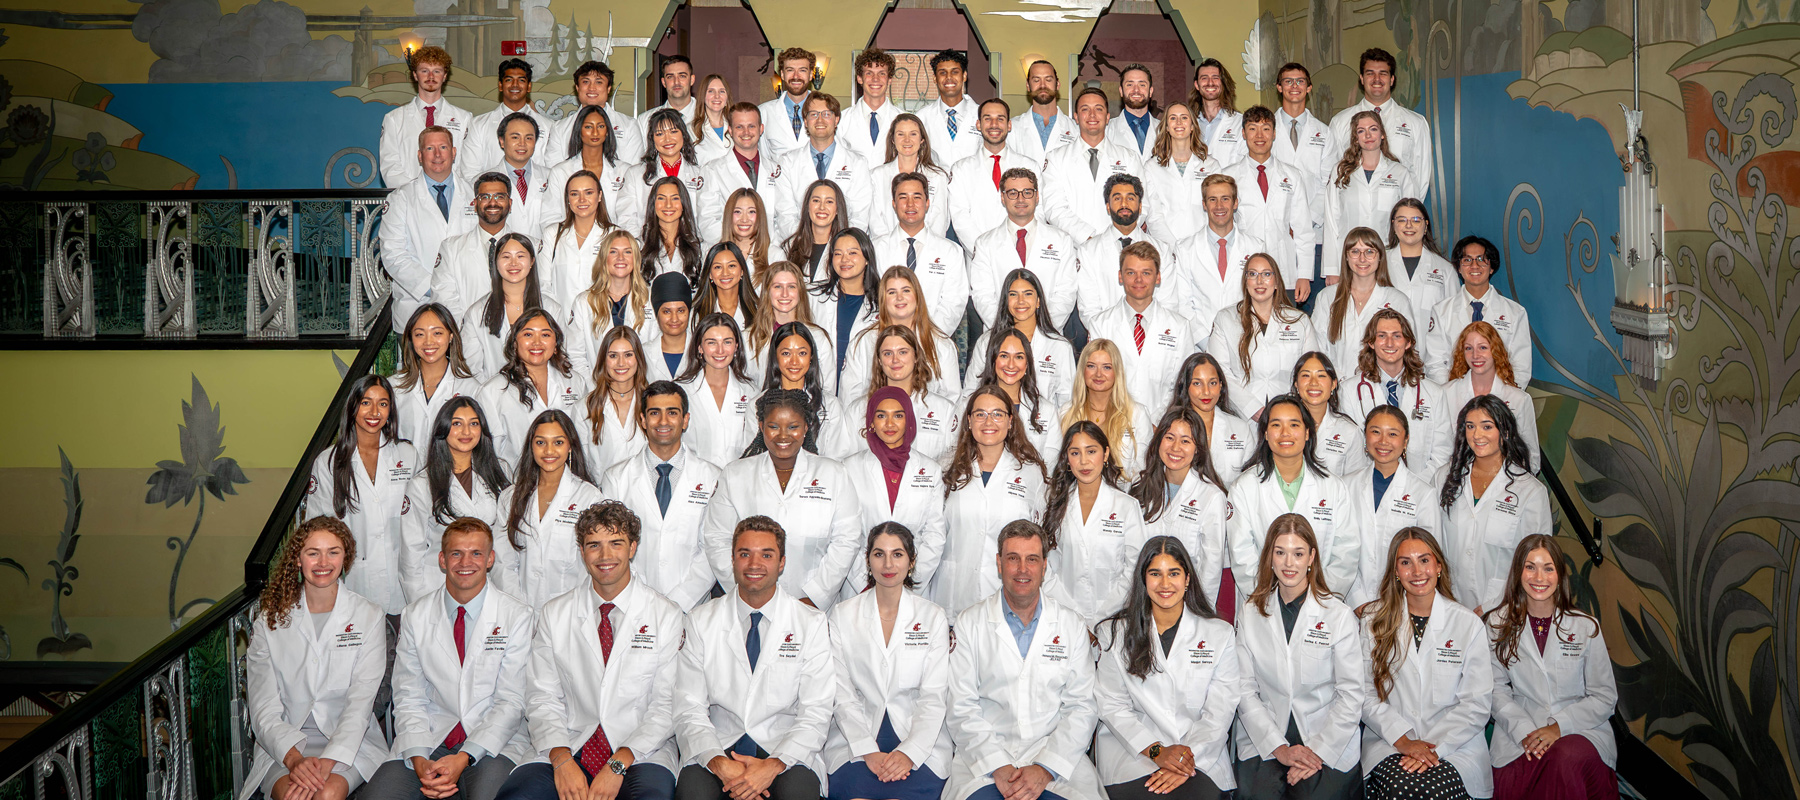
MD Class Demographics and Statistics
Demographic Stats (Class of 2027–2030)
The demographics and academic statistics for the Elson S. Floyd College of Medicine current student body. The College of Medicine’s full cohort consists of about 320 students. 100% of our students have strong ties to Washington or are residents of Washington.
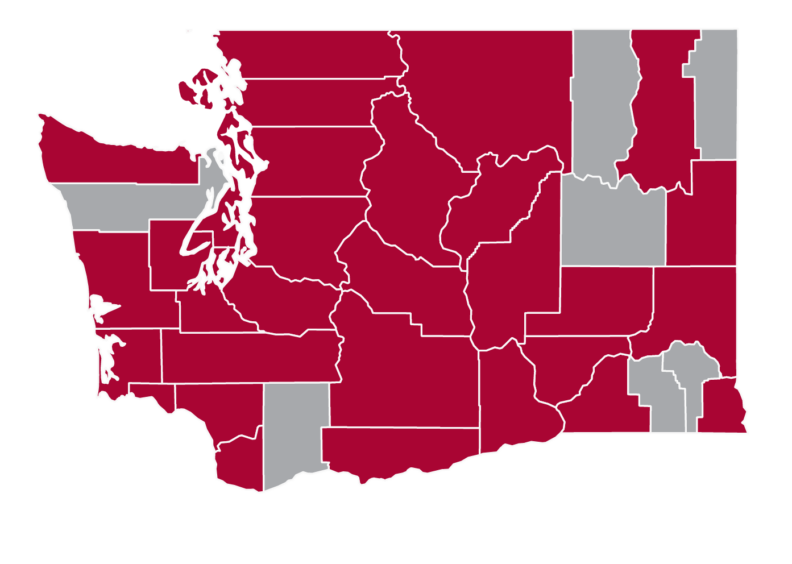
32 Counties Represented
(Childhood or Permanent Address)
Adams, Asotin, Benton, Chelan, Clallam, Clark, Cowlitz, Douglas, Franklin, Grant, Grays Harbor, Island, King, Kitsap, Kittitas, Klickitat, Lewis, Mason, Okanogan, Pacific, Pierce, San Juan, Skagit, Snohomish, Spokane, Stevens, Thurston, Walla Walla, Wahkiakum, Whatcom, Whitman, and Yakima.
94.4% Washington Residents (Other 5.6% had ties to WA; 83.1% had at least 3 defined ties to WA)
15% Childhood Rural County (Based on AMCAS and WA Office of Financial Management)

(Black/African American, American Indian Alaska Native, Hispanic)

(Parents did not earn bachelor’s degree)

35 Languages Spoken: American Sign Language, Amharic, Arabic, Armenian, Chinese, Croatian, Czech, Danish, English, French, German, Greek, Gujarati, Hebrew, Hindi, Italian, Japanese, Korean, Latin, Malayalam, Mon_Khmer, Persian, Portuguese, Punjabi, Russian, Slovak, Spanish, Swedish, Tagalog, Tamil, Turkish, Ukrainian, Urdu, Vietnamese, Other Unspecified
^Not considered in admissions per law; reported only as additional demographics of the class
*FERPA guidelines recommend not reporting characteristics amounting to less than 5
Academic Stats*
*MCAT and GPAs are masked in the application process. They are only considered as criteria to receive a secondary application.
Additional Demographics
You can also browse the demographics of the recently matriculated class as well as longitudinal admissions pool statistics to illustrate the complete, interviewed and offered pools each year below the student body data.